
Introduction
In the world of financial trading, understanding market trends and price movements is crucial for successful decision-making. One of the most valuable tools for traders is the Price Action Indicator. This indicator provides valuable insights into price movements, helping traders make informed choices and maximize their profits. In this article, we will explore what the Price Action Indicator is, how it works, and how traders can utilize it to their advantage.
What is a Price Action Indicator?

At its core, the Price Action Indicator is a technical analysis tool used in financial markets to analyze and predict price movements based on historical price data. Unlike other complex indicators that involve numerous calculations and algorithms, the Price Action Indicator focuses solely on the study of historical price patterns and chart formations. This makes it a preferred choice for traders who seek simplicity and accuracy in their trading strategies.
Understanding Price Action Patterns
The Price Action Indicator identifies various patterns that appear on price charts, which provide critical insights into market sentiment and potential price direction. Some common price action patterns include:
1. Pin Bar Reversal
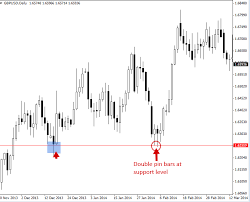
The Pin Bar is a single candlestick pattern that indicates a potential trend reversal. It features a long tail (wick) and a small body, resembling a pin. When a Pin Bar forms after a sustained uptrend or downtrend, it can signal a possible reversal in the market direction.
2. Double Tops and Bottoms
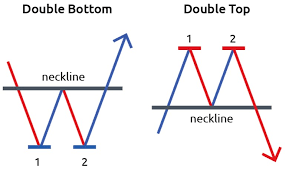
Double tops and bottoms are chart patterns that occur when the price reaches a high (double top) or a low (double bottom) twice before reversing. These patterns are essential in identifying potential trend reversals and trading opportunities.
3. Engulfing Candlestick Pattern
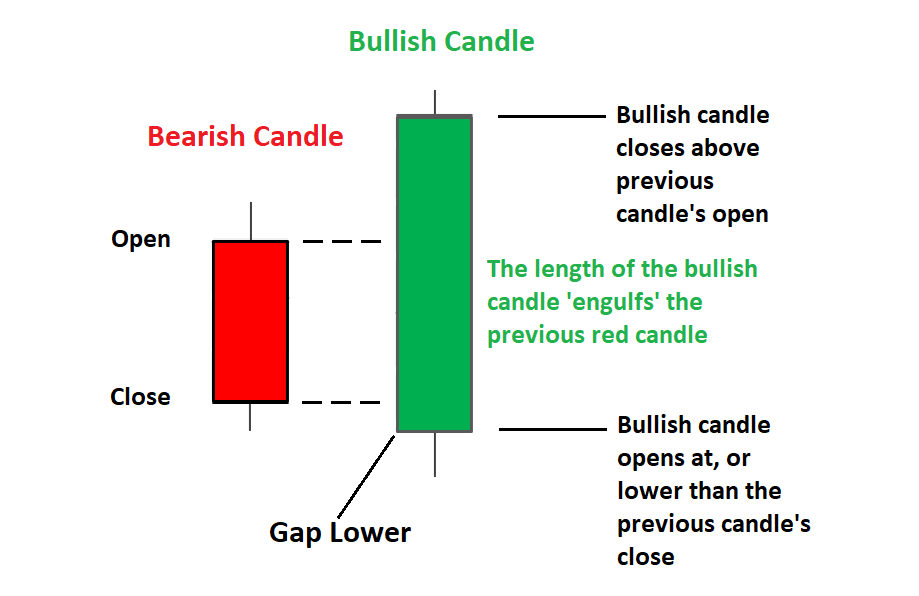
The Engulfing Pattern occurs when a larger candle completely engulfs the previous smaller candle. It signifies a shift in market sentiment and can indicate a trend reversal or a continuation.
4. Head and Shoulders Pattern
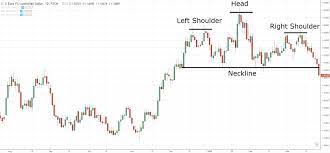
The Head and Shoulders pattern is a powerful reversal pattern that resembles three peaks, with the middle peak (the head) being the highest. This pattern suggests a potential shift from bullish to bearish or vice versa.
Using Price Action Indicator in Trading
The Price Action Indicator offers several advantages for traders looking to enhance their strategies:
1. Simplicity and Clarity
Price action analysis simplifies the trading process by focusing on the most critical aspect—the price movement itself. Traders can quickly grasp market sentiment and make informed decisions without the need for complex calculations.
2. Real-time Decision Making
Since price action analysis primarily uses historical price data, traders can make real-time decisions without delays caused by lagging indicators. This feature is particularly beneficial for day traders and scalpers.
3. Enhanced Risk Management
Price action trading provides traders with clear entry and exit signals, making it easier to manage risk effectively. Identifying key support and resistance levels helps set appropriate stop-loss and take-profit levels.
4. Adaptability to Any Market
The Price Action Indicator is not limited to specific financial instruments or timeframes. Traders can apply this technique to stocks, forex, cryptocurrencies, and other markets.
Common Mistakes in Price Action Trading
While price action trading can be highly effective, traders should be aware of common mistakes that can lead to suboptimal results:
1. Overtrading
Traders may be tempted to execute multiple trades in a short period, leading to increased transaction costs and potential losses.
2. Ignoring Fundamental Analysis
Price action analysis should be complemented with fundamental analysis to gain a comprehensive understanding of the market.
3. Failing to Use Stop-loss Orders
Risk management is crucial in trading, and not using stop-loss orders can expose traders to substantial losses.
Conclusion
The Price Action Indicator is a powerful tool that simplifies the trading process and enhances decision-making. By studying historical price patterns, traders can gain valuable insights into market sentiment and potential price movements. When used correctly, the Price Action Indicator can significantly improve trading strategies and increase profitability.
FAQs
1. Can the Price Action Indicator be used with other technical indicators?
Yes, traders often combine the Price Action Indicator with other technical tools like moving averages and Bollinger Bands to strengthen their analysis.
2. Is price action analysis suitable for beginners?
Absolutely! Price action analysis is beginner-friendly and provides a solid foundation for understanding market behavior.
3. Does the Price Action Indicator work in all market conditions?
The Price Action Indicator is versatile and can be applied to various market conditions, but it is essential to adapt strategies to suit specific market situations.
4. Can price action patterns predict market crashes?
While price action patterns can signal potential reversals, predicting market crashes with certainty is challenging.
5. Are there any limitations to using the Price Action Indicator?
The main limitation is that it relies solely on historical price data and does not consider external factors that could impact the market.